
A Stats-Driven Power Ranking
March 25, 2014
I used the win probability metric, which I described here, to calculate the average probability that each team wins each of their games. Then, for each team, I calculate a weighted-average (based on the logged temporal distance) of their win probabilities. In other words, the most recent game gets the highest weight, while game 1 is still in the calculation, but significantly down-weighted.
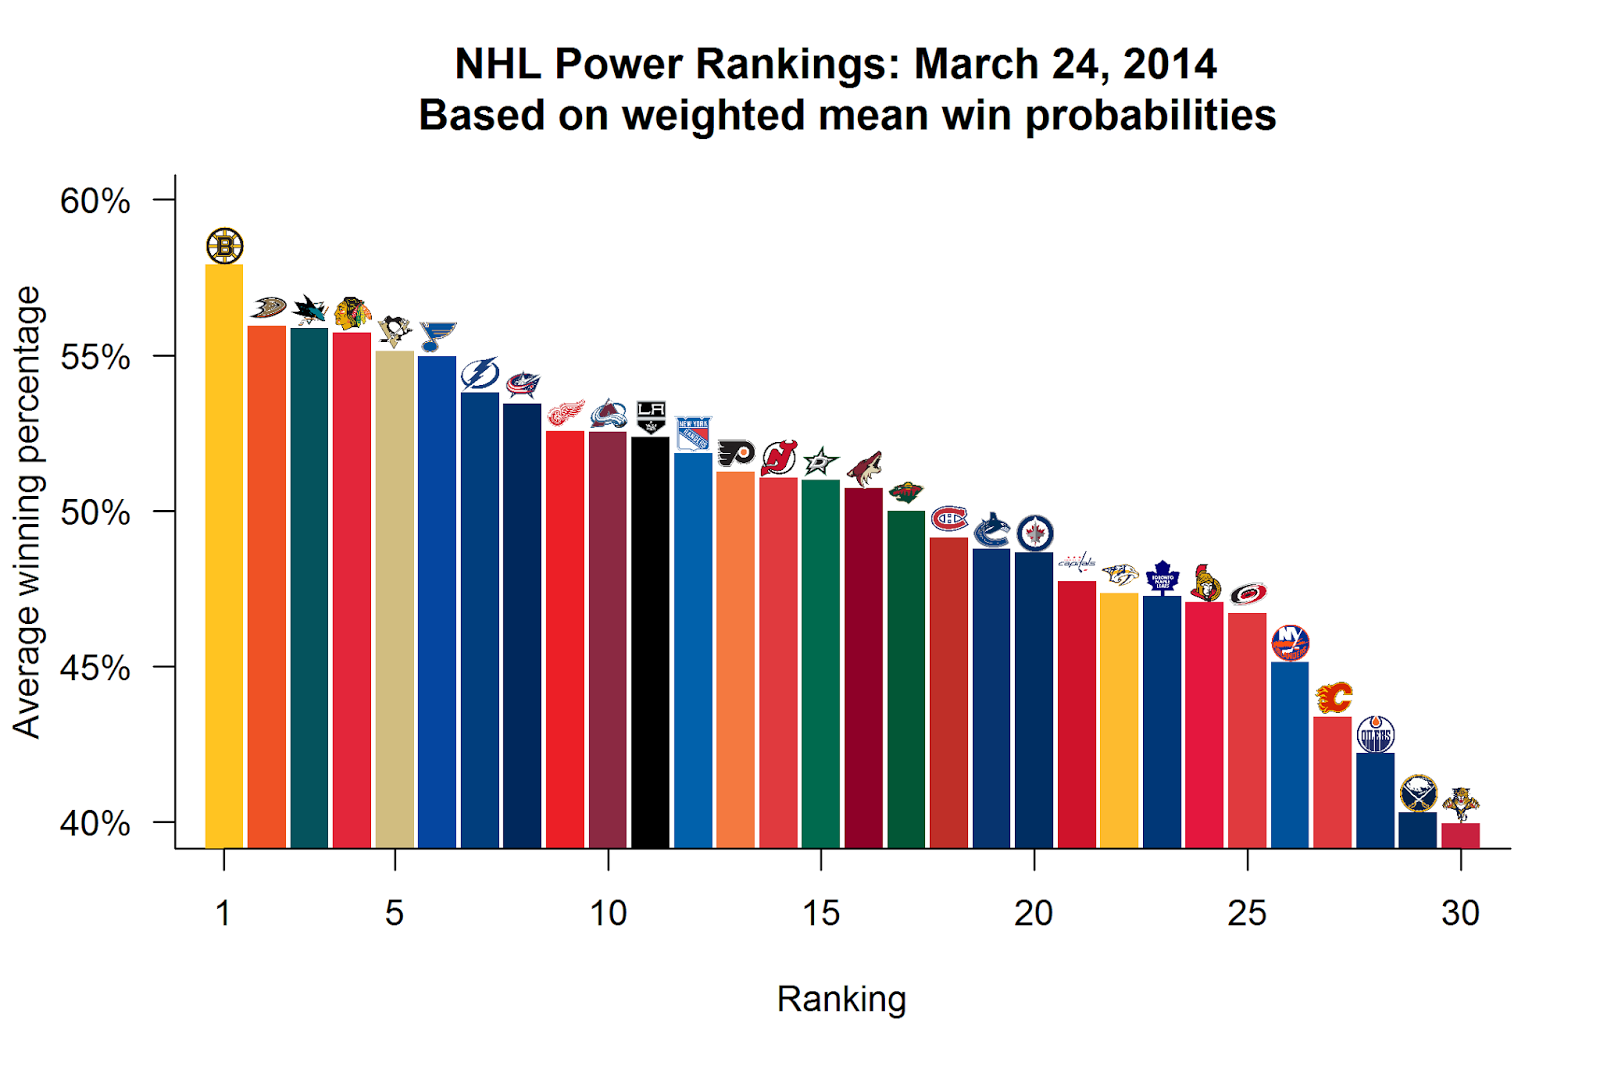
The result is a new power ranking metric, which is entirely based on in-game statistics. As far as I know (and please correct me if I’m wrong) but it’s also the first power ranking (in any sport?) which doesn’t just provide the ranks of the teams (1 through 30) but gives a sense of how big the gaps are between teams 1 and 2, 2 and 3, etc. Check out the results below, which are based on every game this season (excluding last night’s).
As you can see, not only is Boston the top-ranked team, it’s doing significantly better than the other teams in the top 5, mostly because of their dominance during their 12 game win streak. And you can see there’s a huge dropoff in teams 25-30.