

What wins hockey games?
October 27, 2013
What wins a hockey game? We often hear from announcers things like, “The team that wins in the faceoff circle will win this game” or “They’ve got to get the puck on the net if they want to win tonight.” But which of these statements are true? More generally, which team stats are best at predicting who wins hockey games?
I take a first stab at that question here by looking at what correlates with winning hockey games. I use seven years of NHL play-by-play data to generate statistics like shot-differential, hit-differential, faceoff win-differential, etc. and then use those statistics as variables in logistic regression in order to evaluate who wins games and why.
What surprised me is that the statistic that I would have guess correlates most strongly with winning (shots on goal) is highly correlated with winning, but in the wrong direction. That’s to say, the team that takes more shots in a game is, on average, less likely to win the game. More predictably, I also find that winning faceoffs and being the beneficiary of turnovers both positively contribute to a team’s chances of winning.
To answer do my analysis, I used my cleaned dataset of more than 2 million plays in every season from 07-08 through 12-13. For each game I calculated the number of times the home and away teams registered several different types of statistics. Specifically I considered shots on goal, blocked shot attempts, missed shots, hits, faceoff wins, and turnovers. I then took the difference between the two teams for each of these statistics (e.g.: home SOG minus away SOG).
From there, I used logistic regression to evaluate how each of these six factors played a role in whether the home team won or lost the game. Logistic regression is similar to linear regression except, instead of having a dependent (response) variable that possibly ranges from negative infinity to infinity, the dependent variable takes a value of zero (home team loses) or one (home team wins). One advantage of this approach is that it allows me to consider the effect of one variable (say, shots on goal) on winning probability, while “controlling” for the other five variables.
Instead of presenting a complicated table of results from the regression (which even trained statisticians would struggle to easily and effectively interpret), I turned the results into easily interpretable graphs.
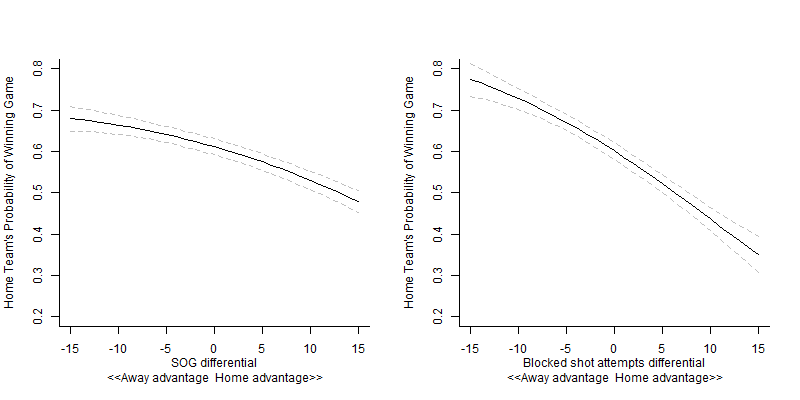
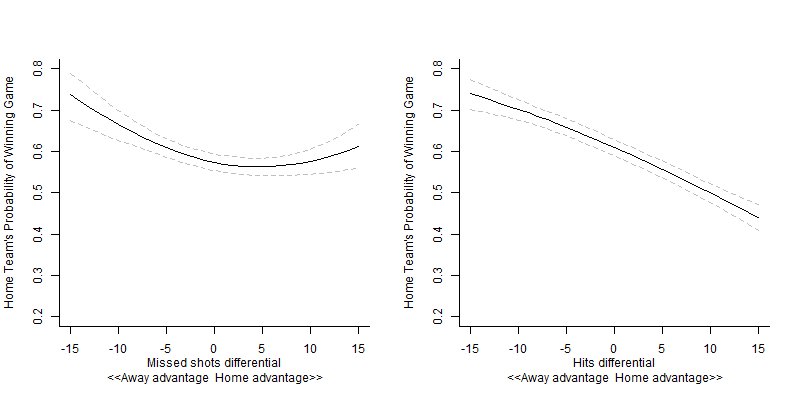
The first set of graphs show, what I think, are the most surprising results. The first graph shows that as the home team takes more and more shots (relative to the away team) the home team’s probability of winning decreases. Similarly, the big positive differences in blocked shot and missed shot attempts also correspond with lower win probabilities for the home team.
These findings are particularly interesting because of what they suggest about the increasingly-popular Corsi and Fenwick statistics. Corsi can be thought of as the plus-minus for a player or a team, except instead of measuring goal plus-minus it measures plus-minus for all shot attempts (shots on goal, missed shots, and blocked shots). Fenwick is similar, except it omits blocked shots from its calculation. The results of my analysis imply that high values of Corsi and Fenwick should actually correlate with lower probabilities of winning games.
In addition to the results related to shooting the puck, the regression tells us some things about a few other common statistics. First, big differences in the number of hits appears to favor the team receiving the hits rather than the one dishing them out. This result confirms what I found in an earlier post.
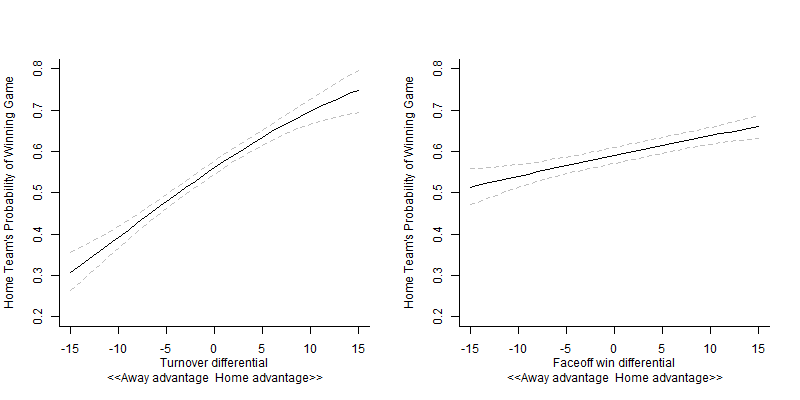
Second, winning the turnover battle pays big dividends. Generating five extra turnovers during the course of the game increases a team’s probability of winning by about 10%. Third, winning faceoffs also makes a team more likely to win a game, although this effect isn’t as big as somebody might expect.
Third Period Effects?
One possible explanation for why shot attempts has the opposite effect on winning probabilities as we’d expect is that desperate teams trailing on the scoreboard might tend to throw the puck at the net a lot more. To account for this possibility I did the same set of analyses as above, except this time I restricted the data so that I was only looking at third period stats in games that were tied entering the third.
Games that are tied entering the third should shouldn’t have the problem of the data being distorted by desperate strategies by teams trailing on the scoreboard. Luckily because the dataset is so big, even restricting the analysis to these games leaves me with over 900 games to analyze. The graphs below show the results from this analysis.
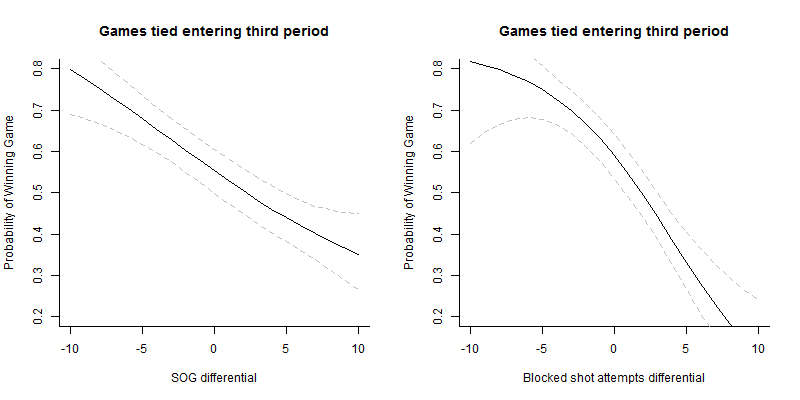
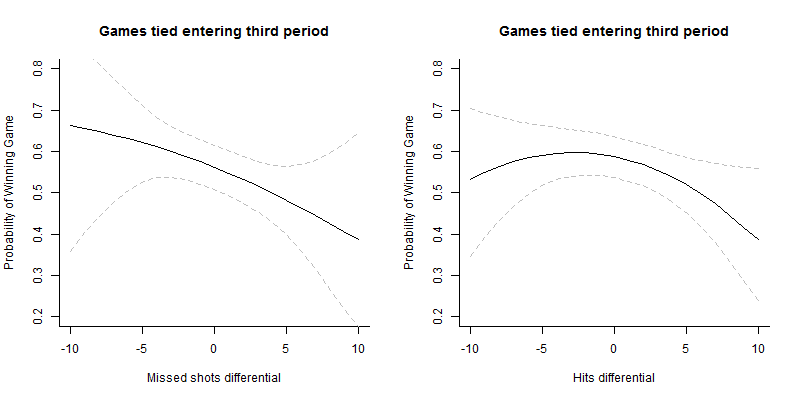
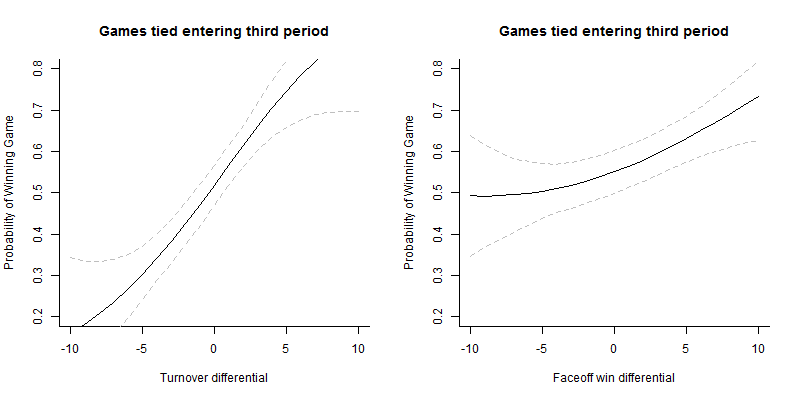
The patterns in close third period games are very similar to those in games overall. Shooting more often diminishes your chance of winning the game. I think the most interesting thing to point out is how large the effects of turnovers and faceoffs are. Generating an extra turnover or two in the third period can cause a team’s chances of winning to jump by 5 or 10 percentage points. Likewise, winning an extra faceoffs or two gives a team a nice bump in their winning probability.
So what have we learned? Shooting the puck more often might not be all it’s cracked up to be. Same with hitting. And if you want to win games, then win the faceoff battle and create turnovers in your favor.